Real-Time Visibility
Email Volume Reporting
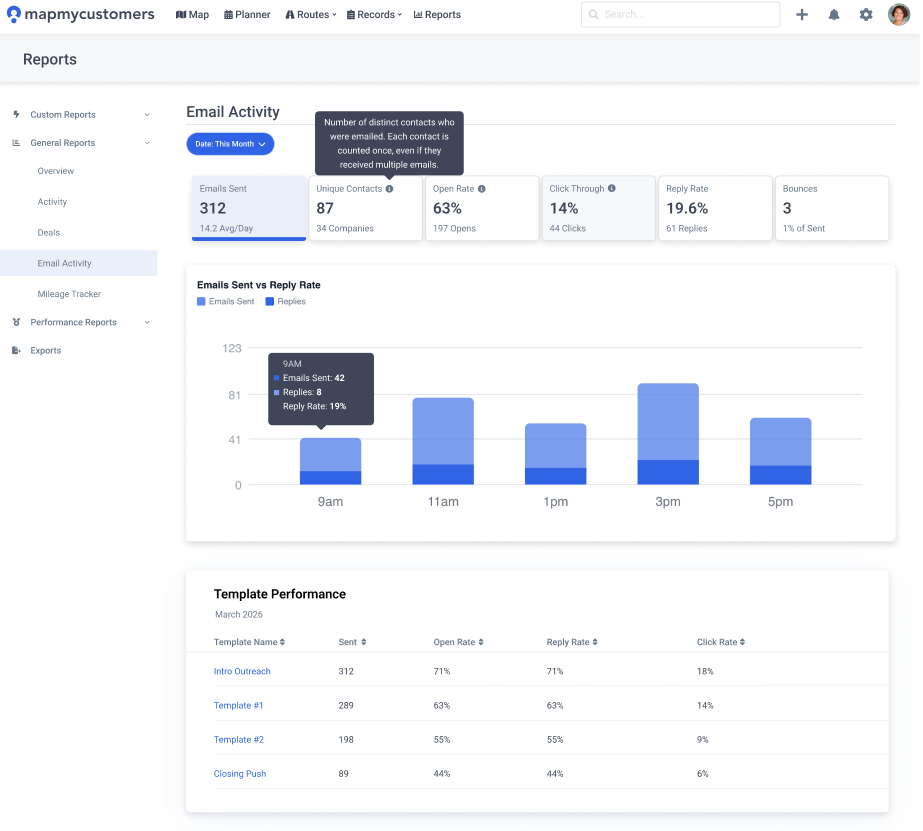
Comprehensive email analytics dashboard showing sends, open rates, click-through rates, reply rates, and bounces. Template performance comparison helps optimize outreach over time.
Comprehensive email analytics dashboard showing sends, open rates, click-through rates, reply rates, and bounces. Template performance comparison helps optimize outreach over time.
Track total sends, opens, clicks, replies, and bounces across your team. See trends over time and identify which reps are driving the most engagement.
Visualize the ratio of outbound emails to replies with clear bar and line charts. Spot engagement drops early and adjust your outreach strategy.
Compare open rates, click rates, and reply rates across every email template. Double down on what works and retire what doesn't.
Filter all email metrics by custom date ranges: last week, last month, last quarter, or any custom window. Track performance over the periods that matter.
Navigate to Email Reporting to see a real-time overview of your team's email activity, engagement metrics, and template performance.
Set date ranges, filter by rep or territory, and compare template performance side by side to find your highest-performing outreach.
Use the data to refine templates, adjust send timing, and coach reps on email best practices. Track improvement over time.

Request a demo
Map My Customers helps field sales teams run the day-to-day work that drives revenue. Learn how teams reduce admin, improve coverage, and create stronger field performance.